We had respondents from 63 countries, representing 44 different languages. Quite a diverse group of followers.
| Country | Responses | % of Total |
|---|---|---|
| United States | 329 | 31.8% |
| United Kingdom | 86 | 8.3% |
| Germany | 83 | 8.0% |
| France | 82 | 7.9% |
| Canada | 45 | 4.4% |
| "NO ANSWER" | 32 | 3.1% |
| Netherlands | 31 | 3.0% |
| Australia | 26 | 2.5% |
| India | 25 | 2.4% |
| Spain | 22 | 2.1% |
| Brazil | 21 | 2.0% |
| Sweden | 19 | 1.8% |
| Italy | 18 | 1.7% |
| Russian Federation | 17 | 1.6% |
| Switzerland | 16 | 1.5% |
| Argentina | 16 | 1.5% |
| Portugal | 14 | 1.4% |
| Norway | 12 | 1.2% |
| Finland | 12 | 1.2% |
| Poland | 11 | 1.1% |
| Greece | 11 | 1.1% |
| Hungary | 9 | 0.9% |
| Belgium | 9 | 0.9% |
| South Africa | 6 | 0.6% |
| Austria | 6 | 0.6% |
| Israel | 5 | 0.5% |
| Denmark | 5 | 0.5% |
| Czech Republic | 5 | 0.5% |
| Serbia | 4 | 0.4% |
| Venezuela | 3 | 0.3% |
| Romania | 3 | 0.3% |
| New Zealand | 3 | 0.3% |
| Mexico | 3 | 0.3% |
| Ireland {Republic} | 3 | 0.3% |
| Ukraine | 2 | 0.2% |
| Turkey | 2 | 0.2% |
| Slovenia | 2 | 0.2% |
| Slovakia | 2 | 0.2% |
| Luxembourg | 2 | 0.2% |
| Latvia | 2 | 0.2% |
| Japan | 2 | 0.2% |
| Indonesia | 2 | 0.2% |
| Costa Rica | 2 | 0.2% |
| Colombia | 2 | 0.2% |
| China | 2 | 0.2% |
| Chile | 2 | 0.2% |
| Bulgaria | 2 | 0.2% |
| Uruguay | 1 | 0.1% |
| Thailand | 1 | 0.1% |
| Singapore | 1 | 0.1% |
| Saudi Arabia | 1 | 0.1% |
| Philippines | 1 | 0.1% |
| Peru | 1 | 0.1% |
| Malta | 1 | 0.1% |
| Madagascar | 1 | 0.1% |
| Lithuania | 1 | 0.1% |
| Kenya | 1 | 0.1% |
| Iceland | 1 | 0.1% |
| Egypt | 1 | 0.1% |
| Cuba | 1 | 0.1% |
| Croatia | 1 | 0.1% |
| Belarus | 1 | 0.1% |
| Afghanistan | 1 | 0.1% |
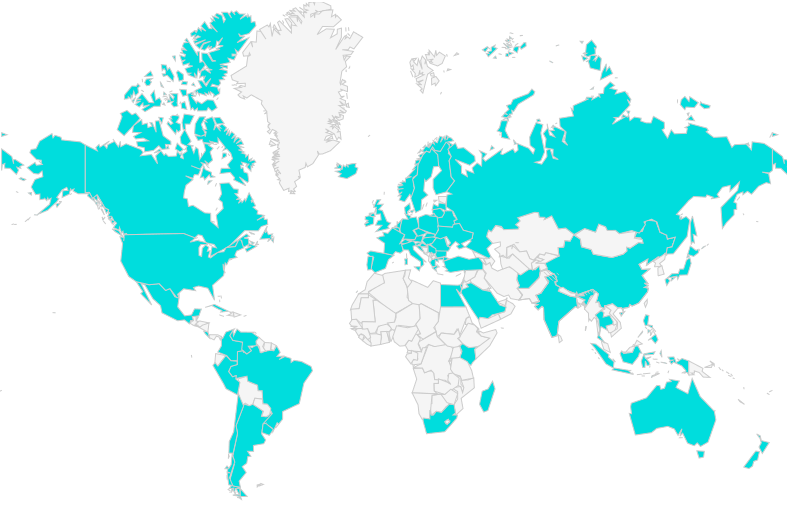
Countries participating
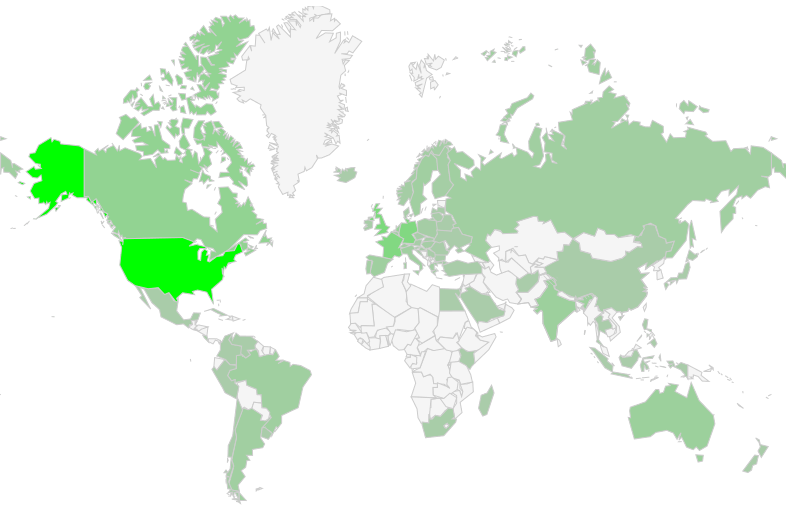
Countries by number of responses
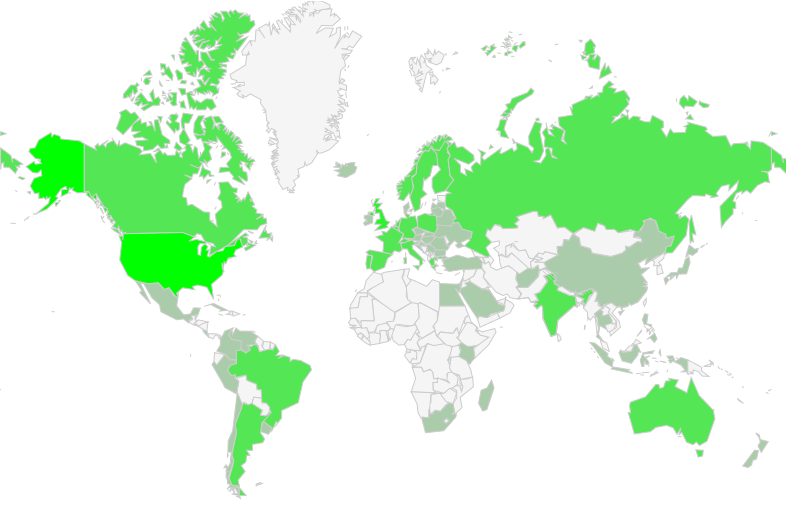
Countries weighted into 5 groups:
> 300 people, > 100, > 10, > 1 and 0
| Languages | Country Respondent Count | % of All Languages |
|---|---|---|
| English | 489 | 48.7% |
| German | 105 | 10.5% |
| French | 82 | 8.2% |
| Spanish | 53 | 5.3% |
| Dutch | 40 | 4.0% |
| Portuguese | 35 | 3.5% |
| Hindi | 25 | 2.5% |
| Swedish | 19 | 1.9% |
| Italian | 18 | 1.8% |
| Russian | 17 | 1.7% |
| Norwegian | 14 | 1.4% |
| Finnish | 12 | 1.2% |
| Polish | 11 | 1.1% |
| Greek | 11 | 1.1% |
| Hungarian | 9 | 0.9% |
| Zulu | 6 | 0.6% |
| Hebrew | 5 | 0.5% |
| Danish | 5 | 0.5% |
| Czech | 5 | 0.5% |
| Serbian | 4 | 0.4% |
| Romanian | 3 | 0.3% |
| Irish | 3 | 0.3% |
| Ukrainian | 2 | 0.2% |
| Turkish | 2 | 0.2% |
| Standard | 2 | 0.2% |
| Slovene | 2 | 0.2% |
| Slovak | 2 | 0.2% |
| Luxembourgish | 2 | 0.2% |
| Latvian | 2 | 0.2% |
| Japanese | 2 | 0.2% |
| Indonesian | 2 | 0.2% |
| Bulgarian | 2 | 0.2% |
| Arabic | 2 | 0.2% |
| Thai | 1 | 0.1% |
| Swahili | 1 | 0.1% |
| Maltese | 1 | 0.1% |
| Malay | 1 | 0.1% |
| Malagasy | 1 | 0.1% |
| Lithuanian | 1 | 0.1% |
| Icelandic | 1 | 0.1% |
| Filipino | 1 | 0.1% |
| Dari | 1 | 0.1% |
| Croatian | 1 | 0.1% |
| Belarusian | 1 | 0.1% |